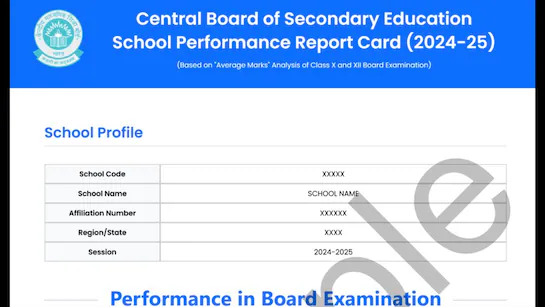
Presenting data is one of the most important parts of academic writing. It’s how you turn numbers and findings into something that makes sense for readers. A report full of raw data might look impressive, but if it’s not clear or easy to understand, it loses its value. Presenting data effectively means combining accuracy, clarity, and visual appeal.
The first rule of data presentation is know your purpose. Why are you showing this data? Are you proving a point, supporting a hypothesis, or explaining a trend? Your purpose will decide how to organize and display information. For example, if you’re showing growth over time, a line graph works best. If you’re comparing categories, a bar chart or table may be more effective.
Clarity is everything. Don’t overload your report with unnecessary numbers or details. Show only what supports your argument or analysis. Too much data can confuse the reader. For every chart or table, ask yourself: “Does this help explain my point?” If not, leave it out.
When you use tables, make sure they are clean and labeled properly. Every table should have a title that tells what the data shows. Label columns and rows clearly, and include units like “percent,” “kilograms,” or “years.” Always cite where your data comes from, especially if it’s from another source.
For graphs and charts, simplicity works best. Avoid bright colors or cluttered designs. Use labels, legends, and scales that are easy to read. Your goal is to help readers understand your results quickly, not to decorate the page.
Explain your data in words, too. Never just drop a chart and move on. Describe what the data means. For example, don’t just show a bar graph of test results — explain what it shows: “As seen in Figure 2, students who studied more than three hours daily scored significantly higher.” Linking visuals to text helps readers follow your reasoning.
Keep your formatting consistent. Use the same font size, style, and layout for all visuals. This makes your report look professional and organized. Place figures near the text that discusses them, so readers don’t have to flip pages to find context.
If you’re using statistical results, explain them in plain language. Instead of writing, “p < 0.05,” you can add, “The results are statistically significant, meaning the difference was unlikely due to chance.” Clear explanations make your report accessible to readers who may not have a strong math background.
Avoid manipulating data to fit your argument. Academic honesty means showing results truthfully, even if they don’t match your expectations. Misleading charts — like cutting off the y-axis to exaggerate changes — might seem tempting but can destroy your credibility.
Use appendices for extra data. If you have large tables or detailed calculations, move them to the appendix and refer to them in your main report. This keeps your main content focused while still providing full transparency.
Finally, practice visual balance. Too many visuals can be as bad as too few. Choose visuals that add meaning, not just decoration. Every graph or chart should help tell your story more clearly.
Final Thought:
Good data presentation turns information into understanding. It’s not about showing off numbers — it’s about making them speak. When you present data clearly, honestly, and simply, your report becomes stronger, and your message becomes impossible to ignore.
Leave a Reply